How Splunk Helps in Incident Response and Forensics
It is 2:47 a.m. in Pune. Your phone vibrates on the nightstand. The message from the SOC team is short and urgent: “Finance server compromised. Possible ransomware.” Your stomach tightens. The company’s quarterly earnings are due in 48 hours. A full outage could cost millions. You open your laptop, log into Splunk, and type a single search. Within 15 seconds, a timeline appears: suspicious login at 2:12 a.m., PowerShell execution at 2:15 a.m., 400 GB uploaded to an unknown IP at 2:20 a.m. You trace the source to a phishing email sent 6 hours earlier. You isolate the server, block the IP, and notify leadership. The breach is contained before it spreads. This is not a drill. This is Splunk powering real-world incident response. When a security incident strikes, every second counts. Attackers move fast. Defenders must move faster. Splunk is the tool that turns chaos into clarity. It collects logs from every corner of your environment: firewalls, servers, cloud platforms, endpoints, and email gateways. Then it helps you detect, investigate, contain, and recover, all from one interface. This guide shows exactly how Splunk supports incident response and digital forensics. We cover the full lifecycle, real-world examples, and practical queries you can use today. Even if you are new to security, you will walk away knowing how Splunk can save your organization when things go wrong.
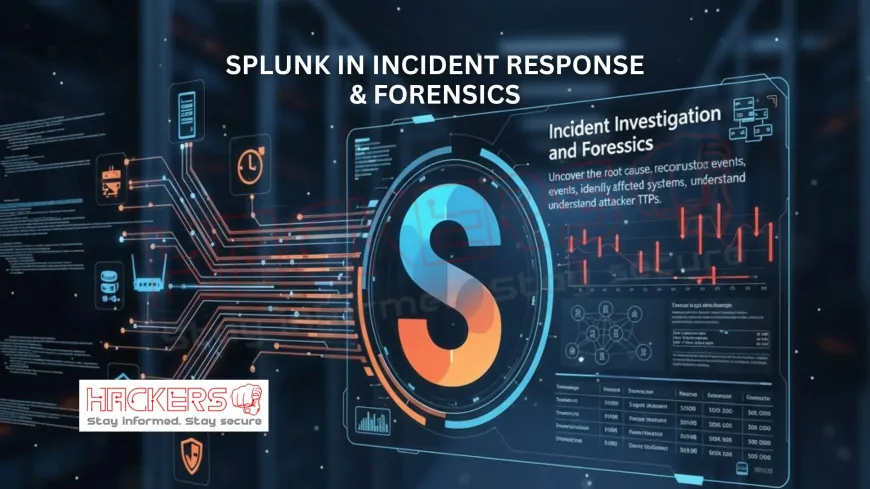
Table of Contents
- What Is Incident Response and Digital Forensics?
- How Splunk Fits into Incident Response
- Key Splunk Capabilities for IR and Forensics
- Splunk Across the Full IR Lifecycle
- A Real-World Ransomware Response Scenario
- Top 15 Splunk Queries for Digital Forensics
- Quick Reference: Forensics Query Table
- Best Practices for Using Splunk in IR
- Conclusion
What Is Incident Response and Digital Forensics?
Incident Response (IR) is the structured process of handling a security breach. It follows six phases: Preparation, Identification, Containment, Eradication, Recovery, and Lessons Learned. The goal is to minimize damage and restore normal operations quickly.
Digital Forensics is the scientific process of collecting, preserving, analyzing, and presenting digital evidence. It answers the critical questions: What happened? When? Who did it? How can we prove it?
Splunk supports both. It acts as your central evidence locker, search engine, and timeline builder during an incident.
How Splunk Fits into Incident Response
Splunk is more than a log aggregator. It is a full Security Information and Event Management (SIEM) platform, especially when paired with Splunk Enterprise Security (ES). Even without ES, core Splunk provides:
- Real-time ingestion from 250+ data sources
- Full-text and field-based search across years of data
- Event correlation across systems
- Visual timelines and interactive dashboards
- Exportable, tamper-evident reports for legal use
During an incident, Splunk becomes your investigative command center.
Key Splunk Capabilities for IR and Forensics
- Long-Term Retention: Store logs for 90 days (hot), 1 year (warm), or 7+ years (cold) for forensic replay.
- Event Sequencing: Reconstruct exact order using precise timestamps.
- Drill-Down: Click any event to see raw log, metadata, and related activity.
- Transaction Command: Group related events (login → file access → data upload) into one session.
- Field Extraction: Automatically pull IPs, usernames, file paths, and hashes from raw logs.
- Data Models: Pre-structured views (e.g., Authentication, Network Traffic) for faster searches.
- Chain of Custody: Export results with user, time, and query metadata for court admissibility.
Splunk Across the Full IR Lifecycle
Preparation
- Forward critical logs: Windows Security, Sysmon, firewall, DNS, proxy, cloud trail
- Build data models and asset lookups
- Create IR playbooks with pre-written Splunk queries
Identification
- Real-time correlation searches flag anomalies
- Notable events in Splunk ES prioritize high-risk activity
- Machine learning detects baseline deviations
Containment
- Identify compromised hosts by user, IP, or process
- Block IPs via firewall integration (Palo Alto, Cisco)
- Disable accounts using Adaptive Response actions
Eradication
- Search for malware by hash, name, or behavior
- Trace lateral movement via RDP, SMB, or SSH logs
- Terminate malicious processes via EDR integration
Recovery
- Compare current state to pre-incident baseline
- Monitor for re-infection with real-time alerts
- Validate restoration from clean backups
Lessons Learned
- Generate full incident timeline in PDF
- Update detection rules based on attacker TTPs
- Train team with post-incident review
A Real-World Ransomware Response Scenario
Incident: A finance manager in Pune clicks a phishing link. Malware encrypts 200 GB of shared files.
Step 1: Detection (2:12 a.m.)
Splunk alert fires:
index=proxy user=finance_mgr url=*update-finance.exe*Step 2: Investigation
Analyst runs:
index=* user=finance_mgr earliest=-2h
| transaction user maxspan=2h
| table _time, sourcetype, action, _raw
Reveals: phishing click → PowerShell download → SMB encryption traffic.
Step 3: Containment
Isolates workstation. Blocks C2 IP via Splunk + Palo Alto integration.
Step 4: Forensics
Runs hash search:
index=endpoint file_hash="*"
| search file_hash="e3b0c44298fc1c149afbf4c8996fb924"
| table _time, host, file_path, user
Finds ransomware on 5 systems.
Step 5: Eradication
Deletes files. Resets passwords. Reimages hosts from known-good images.
Step 6: Recovery & Reporting
Exports timeline as PDF. Sends to leadership and legal. Updates phishing filters.
Top 15 Splunk Queries for Digital Forensics
1. Full User Activity Timeline
index=* user="a.kumar" earliest=-48h@h
| transaction user maxspan=48h
| table _time, sourcetype, action, _raw
2. Suspicious File Access
index=file_monitor
| stats values(file_path), count by user, host
| where count > 100
| sort -count
3. PowerShell Download Cradles
index=security EventCode=4104
| regex ScriptBlockText=".*(WebClient|IEX|Invoke-WebRequest).*"
| table _time, Computer, User, ScriptBlockText
4. Outbound Data Transfer
index=proxy src_ip="192.168.10.50"
| stats sum(bytes_out) as total, values(url) by dest_ip
| where total > 100000000
| sort -total
5. Failed and Successful Logins
index=security (EventCode=4625 OR EventCode=4624)
| stats count, values(src_ip) by Account_Name
| where count > 15
6. Malware by File Hash
index=endpoint file_hash="*"
| search file_hash="a94a8fe5ccb19ba61c4c0873d391e987"
| table _time, host, file_path, process_name
7. DNS Tunneling
index=dns
| stats sum(length(query)) as bytes, count by src_ip, query
| where bytes > 2000
| table src_ip, query, bytes
8. RDP Lateral Movement
index=security EventCode=4624 logon_type=10
| stats dc(Computer) as targets, values(src_ip) by Account_Name
| where targets > 2
9. New Service from Temp
index=security EventCode=7045
| where ImagePath="*temp*" OR ImagePath="*downloads*"
| table _time, Computer, ServiceName, ImagePath
10. USB Device Insertion
index=security EventCode=6416 OR EventCode=2003
| stats values(DeviceName), values(Computer) by _time, user
11. Phishing Email Attachments
index=email attachment_name="*.exe" OR attachment_name="*.zip"
| stats values(sender), values(recipient), values(file_hash) by attachment_name
12. Process Parent-Child Tree
index=endpoint parent_process_id=*
| stats values(parent_process_name), values(process_name) by process_id, Computer
| sort process_id
13. Registry Run Key Changes
index=endpoint EventCode=13
| regex _raw=".*HKLM\\Software\\Microsoft\\Windows\\CurrentVersion\\Run.*"
| table _time, Computer, process_name, _raw
14. Unusual Network Connections
index=network dest_port NOT IN (80,443,53,3389,22)
| stats count, values(dest_ip) by src_ip, dest_port
| where count > 50
15. Mass File Deletion
index=file EventCode=4663 action=delete
| stats count, values(file_path) by user, host
| where count > 300
| sort -count
Quick Reference: Forensics Query Table
```html
| Forensic Task | Key SPL Snippet | Data Source | Use Case |
|---|---|---|---|
| User Timeline | transaction user maxspan=48h |
All Logs | Full activity reconstruction |
| File Access Spike | stats count by user, file_path |
File Monitoring | Data exfiltration |
| PowerShell Abuse | "IEX" OR "WebClient" |
EventCode 4104 | Malware delivery |
| Data Upload | sum(bytes_out) > 100MB |
Proxy/Firewall | Exfiltration detection |
| Login Attacks | EventCode=4625 OR 4624 |
Windows Security | Brute force |
| Malware Scope | search file_hash="abc123" |
Endpoint | Infection mapping |
| DNS Tunnel | sum(length(query)) > 2000 |
DNS Logs | C2 communication |
| RDP Hopping | logon_type=10 dc(Computer) |
Windows | Lateral movement |
| Persistence | ImagePath="*temp*" |
EventCode 7045 | Malware survival |
| USB Theft | EventCode=6416 |
Windows | Physical data loss |
| Phishing | attachment_name="*.exe" |
Email Gateway | Initial access |
| Process Chain | parent_process_id |
Sysmon | Attack path |
| Startup Abuse | HKLM\...\Run |
Sysmon | Persistence |
| Rare Ports | dest_port NOT IN (80,443...) |
Network | C2 beaconing |
| Data Wipe | action=delete count > 300 |
File Events | Ransomware |
```
Best Practices for Using Splunk in IR
- Index high-value logs first: Windows Event Logs, Sysmon, firewall, DNS, proxy
- Use hot/warm/cold buckets: fast access to recent data, long-term for forensics
- Tag critical assets: VIP users, finance servers, domain controllers
- Never summarize raw logs during an active incident
- Comment every search:
# IR Case 2025-1106: Ransomware - Export with full metadata: _time, host, user, sourcetype
- Run tabletop exercises monthly with real Splunk queries
- Integrate with SOAR (Phantom, ServiceNow) for automated actions
- Preserve original data with frozen buckets for legal holds
Conclusion
When a breach hits, you do not have time to manually grep through logs. You need a tool that sees every event, connects the dots, and preserves evidence. That tool is Splunk.
From the first suspicious login to the final recovery report, Splunk is with you every step of the way. It detects anomalies in real time. It reconstructs attacker timelines in minutes. It automates containment. It proves compliance. And it helps you get better after every incident.
Start today. Forward one critical log source. Save one timeline query. Run one simulation. Because when the next alert comes at 2 a.m., you will not just respond. You will dominate, thanks to Splunk.
What is incident response?
Incident response is the structured process of detecting, containing, eradicating, and recovering from a security breach.
How does Splunk help in digital forensics?
Splunk stores historical logs, enables timeline reconstruction, and exports tamper-evident evidence for investigations.
Do I need Splunk Enterprise Security for IR?
No. Core Splunk is powerful. ES adds notables, risk scoring, and automated playbooks.
Which logs are essential for forensics?
Windows Security, Sysmon, firewall, DNS, proxy, authentication, and cloud trail logs.
Can Splunk maintain chain of custody?
Yes. Export searches with user, timestamp, and raw data for legal admissibility.
How long should I retain logs?
Hot: 30 to 90 days. Warm: 6 months. Cold: 1 to 7 years for compliance.
What does the transaction command do?
It groups related events (like login, file access, upload) into one coherent session.
Can Splunk automate containment actions?
Yes. Use Adaptive Response to block IPs, disable users, or isolate hosts automatically.
How do I find malware across endpoints?
Search by file hash, process name, or suspicious PowerShell commands.
What are Splunk data models?
Pre-built structures (e.g., Authentication, Network) that speed up complex searches.
Can Splunk detect ransomware early?
Yes. Monitor file entropy, SMB write spikes, or rapid rename events.
How do I export an incident timeline?
Run your search, click Export, and choose PDF or CSV with full fields.
Should I use tstats during IR?
Yes. tstats is 10x faster on accelerated data models for large datasets.
Can Splunk integrate with EDR tools?
Yes. Ingest CrowdStrike, Carbon Black, or Microsoft Defender logs for full visibility.
How do I search for a known bad IP?
Use: index=* (src_ip="185.22.33.44" OR dest_ip="185.22.33.44")
Is Splunk evidence court-admissible?
Yes, when logs are collected properly and chain of custody is documented.
How do I create an IR playbook in Splunk?
Save key searches, build dashboards, and document steps in Confluence or Notion.
Does Splunk support compliance reporting?
Yes. Generate PCI, HIPAA, GDPR, and SOX reports with one click in ES.
What is the best way to learn Splunk for IR?
Take Splunk Fundamentals 1 and 2, then practice with Splunk Security Essentials.
Where can I download IR playbooks?
Splunkbase: ESCU app, Security Essentials, or community GitHub repositories.
What's Your Reaction?


