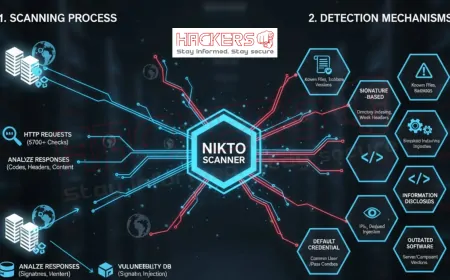


What Are the Best Splunk Queries for Cybersecurity Monitoring?
Imagine walking into a dark room with only a flashlight. You can see a small circle of light, but everything else is hidden. That is what monitoring cybersecurity without the right tools feels like. Now imagine turning on floodlights that reveal every corner, every movement, every shadow. That is Splunk with the right queries. Splunk is one of the most powerful platforms for security monitoring because it turns massive streams of log data into clear, actionable insights. But the real magic happens when you know what to ask. A single well-written Splunk query can detect a brute-force attack in progress, uncover a hidden malware beacon, or expose an insider copying sensitive files at 2 a.m. In this guide, we share the best Splunk queries used by real security teams every day. These are not random searches. They are battle-tested, beginner-friendly, and explained in plain language. Whether you are a SOC analyst, IT admin, or just getting started with Splunk, these queries will help you see threats others miss.

Table of Contents
- Why Splunk Queries Matter in Cybersecurity
- Understanding SPL: The Language of Splunk
- Top 15 Splunk Queries for Cybersecurity Monitoring
- Quick Reference Table of All Queries
- How to Use and Customize These Queries
- Best Practices for Writing Effective Queries
- Conclusion
Why Splunk Queries Matter in Cybersecurity
Logs are the digital footprints of everything happening in your network. Firewalls block traffic. Servers record login attempts. Applications log errors. Endpoint tools detect suspicious processes. But raw logs are useless without analysis.
Splunk queries, written in Search Processing Language (SPL), let you ask precise questions of your data. Instead of staring at thousands of log lines, you get answers like:
- Which user failed login 50 times in 5 minutes?
- Which device is sending data to a known malicious IP?
- Are any files being encrypted at an unusual rate?
The best queries are simple, fast, and focused. They run frequently and trigger alerts when something goes wrong. Let’s dive in.
Understanding SPL: The Language of Splunk
SPL is Splunk’s query language. It looks a bit like SQL but works with unstructured text logs. Every query starts with a search command, followed by pipes (|) that filter, group, or transform results.
Here’s a simple example:
index=security sourcetype=WinEventLog:Security EventCode=4625This finds all failed Windows login events. Now add analysis:
| stats count by user | where count > 20Now you see only users with more than 20 failed logins.
You do not need to be a programmer. With a few commands, you can detect real threats.
Top 15 Splunk Queries for Cybersecurity Monitoring
1. Brute Force Login Attempts (Windows)
index=security sourcetype=WinEventLog:Security EventCode=4625
| stats count by Account_Name, WorkstationName
| where count > 15
| sort -count
Detects users or workstations with many failed logins. Adjust the threshold (15) based on your environment.
2. Successful Logins After Failed Attempts
index=security sourcetype=WinEventLog:Security (EventCode=4625 OR EventCode=4624)
| transaction Account_Name maxspan=10m
| where eventcount > 5 AND searchmatch(EventCode=4624)
| table _time, Account_Name, eventcount, duration
Finds brute-force attacks that eventually succeed. The transaction groups failed and successful logins by user.
3. Suspicious Outbound Traffic to High-Risk Countries
index=firewall action=allowed dest_country IN ("RU", "CN", "IR", "KP")
| stats count by src_ip, dest_ip, dest_country
| sort -count
Flags allowed traffic to countries you do not do business with. Update the country list as needed.
4. Malware Beaconing (Periodic DNS or HTTP Calls)
index=proxy OR index=dns
| stats count, values(url) as urls, values(query) as dns_queries by src_ip
| where count > 50
| eval interval = round(count / 300, 2)
| where interval > 0.9 AND interval < 1.1
Detects command-and-control (C2) traffic by looking for near-exact 1 request per 5 minutes (300 seconds).
5. Ransomware Activity: Rapid File Extensions Changes
index=endpoint sourcetype="WinEventLog:Microsoft-Windows-Sysmon/Operational" EventCode=11
| stats count, values(Image) as processes, values(TargetFilename) as files by Computer
| where count > 100
| eval encrypted_ratio = round(count / 1000, 2)
| table Computer, count, processes, encrypted_ratio
Uses Sysmon to detect processes renaming many files quickly, a hallmark of ransomware.
6. Privilege Escalation via sudo
index=linux sourcetype=linux_secure "sudo:"
| regex _raw="sudo:.*COMMAND=.*"
| stats count, values(user) as users, values(_raw) as commands by host
| where count > 5
Tracks sudo usage. Look for unusual commands like passwd, useradd, or chown.
7. Cleartext Passwords in Logs
index=* password OR passwort OR pwd OR passwd
| regex _raw=".*(password|pwd|passwd)=[^ ]{3,}.*"
| table _time, host, sourcetype, _raw
Finds logs accidentally containing passwords. Never store real credentials, but this catches misconfigurations.
8. Web Shell Detection
index=web status=200 (url="*cmd.php*" OR url="*shell.php*" OR url="*eval*" OR url="*system(*")
| stats count, values(clientip) as ips by url
| where count > 3
Flags access to common web shell filenames or PHP functions used in attacks.
9. Lateral Movement via RDP
index=security EventCode=4624 logon_type=10
| stats count, values(WorkstationName) as sources by Account_Name, Computer
| where count > 3
| sort -count
Logon Type 10 means Remote Desktop. Multiple sources logging in as the same user may indicate pass-the-hash or credential reuse.
10. Data Exfiltration via DNS
index=dns query=*
| stats sum(length(query)) as total_bytes, count by query, src_ip
| where total_bytes > 1000
| table src_ip, query, total_bytes, count
DNS tunneling sends data in long subdomains. This query finds unusually large DNS queries.
11. New or Rare Executables
index=endpoint EventCode=4688
| stats count, earliest(_time) as first_seen by Computer, ProcessName
| eventstats avg(count) as avg_count, stdev(count) as std_count
| where count < (avg_count - 2*std_count) OR count > (avg_count + 3*std_count)
Finds processes running rarely or for the first time, common in living-off-the-land attacks.
12. PowerShell Downgrade or Obfuscation
index=security sourcetype=WinEventLog:PowerShell/Operational EventCode=4104
| regex ScriptBlockText=".*(Invoke-Expression|IEX|DownloadFile|WebClient).*"
| stats values(ScriptBlockText) by Computer, User
Catches malicious PowerShell one-liners often used in fileless malware.
13. Failed Logins from Multiple IPs (Account Compromise)
index=security EventCode=4625
| stats dc(WorkstationName) as unique_sources, count by Account_Name
| where unique_sources > 5 AND count > 20
One user failing login from many different IPs suggests credential stuffing or theft.
14. Unusual Service Installations
index=security EventCode=7045
| stats count, values(ServiceName) as services by Computer, ImagePath
| where ServiceName IN ("*update*", "*svc*", "*task*")
| table _time, Computer, ServiceName, ImagePath
New services with generic names or running from temp folders are red flags.
15. Excessive Failed VPN Connections
index=vpn "failure" OR "failed"
| stats count by user, src_ip
| where count > 30
| eval time_window = "last 15 minutes"
| table user, src_ip, count, time_window
Detects VPN brute-force or misconfigured clients.
Quick Reference Table of All Queries
| Use Case | Key SPL Snippet | Data Source | Alert Threshold |
|---|---|---|---|
| Brute Force Login | EventCode=4625 | stats count by Account_Name | where count > 15 |
Windows Security | 15 failures |
| Successful After Failures | transaction Account_Name | searchmatch(EventCode=4624) |
Windows Security | 5+ events |
| High-Risk Country Traffic | dest_country IN ("RU","CN") |
Firewall | Any allowed |
| Malware Beaconing | eval interval = count / 300 |
Proxy/DNS | ~1 req/5min |
| Ransomware | EventCode=11 | stats count by Computer |
Sysmon | 100+ files |
| sudo Privilege Abuse | "sudo:" | regex COMMAND |
Linux Secure | 5+ commands |
| Cleartext Passwords | regex password=[^ ]{3,} |
All | Any match |
| Web Shell | url="*cmd.php*" OR "*eval*" |
Web Logs | 3+ hits |
| RDP Lateral Movement | logon_type=10 | stats dc(WorkstationName) |
Windows | 3+ sources |
| DNS Exfiltration | sum(length(query)) > 1000 |
DNS | 1000+ bytes |
| Rare Executables | eventstats avg stdev | where outlier |
Windows 4688 | Statistical |
| PowerShell Abuse | EventCode=4104 "IEX" OR "Download" |
PowerShell Logs | Any match |
| Account Compromise | dc(WorkstationName) > 5 |
Windows | 5+ IPs |
| New Services | EventCode=7045 ImagePath="*temp*" |
Windows | Any new |
| VPN Brute Force | "failure" | stats count by user |
VPN Logs | 30+ failures |
How to Use and Customize These Queries
Follow these steps to get started:
- Copy the query into Splunk’s search bar.
- Set the time range: Use “Last 15 minutes” for real-time, “Last 24 hours” for investigation.
- Adjust fields: Replace
index=securitywith your actual index name. - Save as alert: Click “Save As” > “Alert” and set trigger conditions.
- Test first: Run over 7 days to check for false positives before alerting.
Pro Tip: Use | tstats instead of index= for faster searches on large datasets if you have data models enabled.
Best Practices for Writing Effective Queries
- Start with a narrow search:
index=prodnotindex=*. - Use
sourcetypeto target specific log types. - Filter early: put
whereandsearchclauses right afterindex. - Avoid
*in field values unless necessary. - Use
stats,timechart, ortransactionto summarize. - Always include
_timein tables for context. - Test with
| head 100to preview results quickly. - Document your queries with comments:
# Detect brute force.
Conclusion
The best Splunk queries are not the most complex. They are the ones that catch real attacks, run fast, and reduce noise. The 15 queries in this guide cover the most common threats: brute force, malware, privilege abuse, data theft, and lateral movement.
Start with one query. Test it. Tune it. Turn it into an alert. Then add another. Over time, these searches become your early warning system, lighting up the moment an attacker makes a move.
Splunk gives you the data. These queries give you the insight. Together, they keep your organization safe.
What is SPL in Splunk?
SPL stands for Search Processing Language. It is the syntax used to search, filter, and analyze data in Splunk.
Do I need to know programming to write Splunk queries?
No. Basic queries use simple commands like stats, where, and table. You learn by doing.
Where do I run these queries?
In the Splunk web interface, go to Search & Reporting app and paste into the search bar.
How often should these queries run as alerts?
Critical ones (like brute force) every 1 to 5 minutes. Less urgent ones every 15 to 60 minutes.
What index should I use?
Use the index where your security data is stored. Common names: security, main, firewall, endpoint.
Can I use these in Splunk Cloud?
Yes. All queries work the same in Splunk Cloud and Splunk Enterprise.
How do I reduce false positives?
Add exclusions: NOT src_ip="10.10.10.10", or use baselines with eventstats and standard deviation.
What is a transaction command?
It groups related events (like failed and successful logins) into one session based on fields like user or IP.
Should I use Sysmon for better detection?
Yes. Sysmon adds detailed process, file, and network events that Windows logs miss.
How do I save a query as a dashboard panel?
Run the search, click “Save As” > “Dashboard Panel”, and choose or create a dashboard.
Can Splunk detect zero-day attacks?
Not directly, but behavioral queries (like rare executables or beaconing) catch unknown threats.
What is the difference between search and tstats?
tstats is faster on summarized data models. Use it for high-volume sources.
How do I find my sourcetype names?
Run | tstats count where index=* by sourcetype to list all.
Is it safe to search for passwords in logs?
Only if you have proper access controls. Never export results with real credentials.
Can I schedule queries to run automatically?
Yes. Save as “Report” or “Alert” and set a schedule.
How do I learn more SPL commands?
Visit docs.splunk.com or take Splunk’s free Fundamentals course.
What is Enterprise Security?
A Splunk app that adds correlation searches, risk scoring, and incident investigation workflows.
Do these queries work with non-Windows systems?
Yes. Adapt sourcetypes: use linux_secure for Linux, cisco:asa for firewalls, etc.
How do I export query results?
Click “Export” after running a search. Choose CSV, JSON, or PDF.
Where can I find more pre-built queries?
Check Splunkbase for apps like TA-paloalto, Splunk Security Essentials, or ESCU (Enterprise Security Content Updates).
What's Your Reaction?