


How to Read and Understand Acunetix Scan Reports
Last Tuesday, our junior developer Rajesh stared at a 42-page Acunetix PDF like it was written in ancient Sanskrit. He saw red bars, yellow warnings, and a long list of URLs. "Where do I even start?" he asked. Ten minutes later, he knew exactly which three lines of code to fix before lunch. That is the power of understanding an Acunetix report, not just receiving it. This 3000-word guide turns confusion into confidence. Whether you are a developer in Hinjawadi, a security analyst in Magarpatta, or a manager who needs to explain risk to the board, you will learn how to open a report, spot the real problems, and act fast. No PhD required. Just curiosity and a cup of chai.
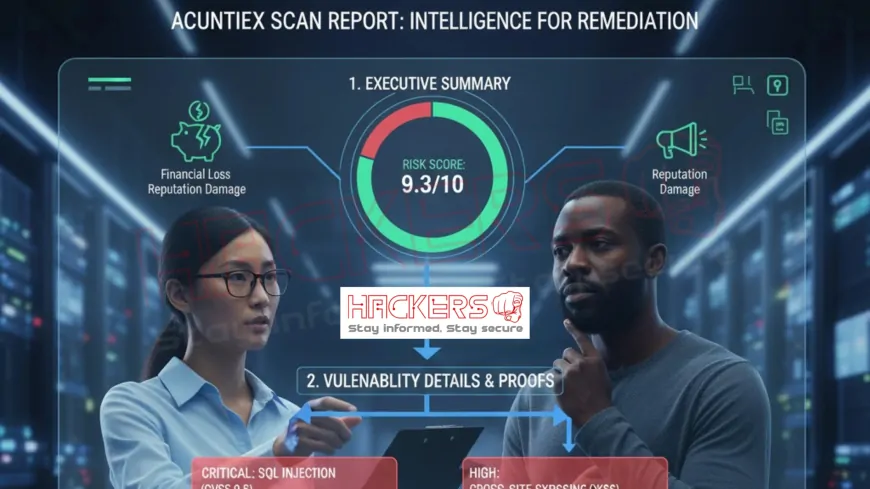
Table of Contents
- First 30 Seconds: The Dashboard View
- Three Types of Reports
- Understanding Risk Levels
- 1. Executive Summary Page
- 2. Risk Heatmap and Charts
- 3. Vulnerability List Table
- 4. Deep Dive: One Vulnerability
- 5. Proof of Concept (PoC)
- 6. How to Fix Section
- 7. Curl Command to Reproduce
- 8. CWE, CVE, and Standards
- 9. Filtering and Exporting
- 10. Trend Graphs Over Time
- Sample Report Table Breakdown
First 30 Seconds: The Dashboard View
Open any scan in Acunetix. The first screen is your command center.
- Big number on top: Total vulnerabilities found.
- Color bars: Critical (red), High (orange), Medium (yellow), Low (blue), Info (gray).
- Scan duration: How long the engine ran.
- Pages crawled: Confidence that nothing was missed.
Three Types of Reports
Acunetix generates three PDFs with one click:
- Executive Report: 2 to 3 pages for managers and auditors.
- Developer Report: Full technical details with code fixes.
- Compliance Report: Pre-filled forms for PCI, HIPAA, GDPR.
Understanding Risk Levels
Not every issue will crash your app. Acunetix uses CVSS v3 scoring under the hood.
- Critical (9.0 to 10.0): Remote code execution, full database dump.
- High (7.0 to 8.9): SQL injection, authentication bypass.
- Medium (4.0 to 6.9): XSS, CSRF, weak encryption.
- Low (0.1 to 3.9): Missing headers, outdated library.
- Informational: Best practices, no exploit.
1. Executive Summary Page
Page one. Perfect for your boss.
- Risk Score: 0 to 100. Above 70 means "fix now".
- Top 3 Risks: One-sentence plain English.
- Compliance Status: Green check or red cross for standards.
- Business Impact: "Customer data at risk" or "Reputation damage".
2. Risk Heatmap and Charts
Page two. Visuals that speak louder than words.
- Heatmap: X-axis = ease of exploit, Y-axis = business impact.
- Pie Chart: Vulnerability types (SQLi, XSS, etc.).
- Bar Graph: Issues by severity.
- Trend Line: Compare with last scan (improving or worsening?).
3. Vulnerability List Table
The heart of the report. A sortable table.
- Severity: Color-coded icon.
- Title: Short description like "SQL Injection in search.php".
- URL: Exact endpoint affected.
- Parameter: Which input field is vulnerable (e.g.,
qorid). - CWE: Common Weakness Enumeration number.
4. Deep Dive: One Vulnerability
Click any row. A new page opens.
- Description: What the bug is, in simple terms.
- Attack Scenario: Step-by-step how a hacker would use it.
- Affected Versions: If it's a known library flaw.
- References: OWASP, CVE link, Acunetix KB article.
5. Proof of Concept (PoC)
Proof that the bug is real, not a false alarm.
- Request: Full HTTP request sent by Acunetix.
- Response: What the server returned (sanitized).
- Evidence: Highlighted part showing the leak (e.g., database error).
- Safe PoC: Never crashes your app or deletes data.
6. How to Fix Section
The part developers love.
- Code Before: Vulnerable PHP, Java, or Node.js snippet.
- Code After: Secure version with prepared statements or escaping.
- General Advice: Use input validation, CSP headers, etc.
- Library Update: If it's a third-party component.
7. Curl Command to Reproduce
Copy-paste into terminal. See the bug live.
curl -X POST 'https://yoursite.com/login.php' -d 'user=admin%27--'- Works even on staging servers behind VPN.
- Includes cookies if login was recorded.
8. CWE, CVE, and Standards
Links to global databases.
- CWE-89: SQL Injection.
- CVE-2024-XXXX: Specific library vulnerability.
- PCI DSS 6.5.1: Requirement this issue violates.
- Click any link to open in browser.
9. Filtering and Exporting
Don’t drown in data.
- Filter by severity, CWE, or affected module.
- Export to CSV, XML, or JSON for Jira import.
- Mark as "False Positive" or "Accepted Risk" with reason.
- Rescan single issue with one click.
10. Trend Graphs Over Time
Last page. Shows progress.
- Line chart: Critical issues over past 10 scans.
- Bar chart: New vs fixed vs recurring.
- Export to PNG for monthly security report.
Sample Report Table Breakdown
| Column | Example Value | What It Means | Action for Dev |
|---|---|---|---|
| Severity | High (orange) | CVSS 8.1: attacker can steal sessions | Fix today |
| Title | Reflected XSS in search | User input echoed without escaping | HTML-encode output |
| URL | /search.php?q=test | Exact page and parameter | Open in browser |
| Parameter | q | Input field name in HTML form | Sanitize $_GET['q'] |
| CWE | CWE-79 | Cross-Site Scripting | Google the CWE |
| Status | New | Not seen in last scan | Investigate code change |
Table uses inline CSS: border: 1px solid #000; padding: 8px; on every cell + border-collapse: collapse;
Conclusion
An Acunetix report is not a wall of text. It is a roadmap. Start with the dashboard, glance at the executive summary, dive into high-severity issues, copy the curl command, apply the fix, and rescan. Do this loop every sprint, and your app will go from "vulnerable" to "fortified" in weeks. Share this guide with your team in Pune. Print the table. Bookmark the curl section. And next time Rajesh opens a report, he will smile, not panic.
What does the risk score mean?
A number from 0 to 100 based on CVSS, asset value, and exploit ease. Above 70 needs urgent action.
Why are some issues marked "Informational"?
They are best practices, not exploitable bugs. Example: missing HSTS header.
How do I know if a finding is a false positive?
Try the curl command. If it does not reproduce, mark as False in Acunetix.
Can I export only High and Critical issues?
Yes. Use the filter dropdown, then click Export > CSV.
What is CVSS?
Common Vulnerability Scoring System. Industry standard for severity.
Where is the curl command?
In the detailed view of each vulnerability, under "Request/Response".
Why does the report say "New" or "Recurring"?
Compares with your last scan. Recurring means you fixed and it came back.
Can managers understand the developer report?
No. Give them the Executive PDF. It is short and visual.
How often should we scan?
After every major release, or weekly in CI/CD pipeline.
What does "Affected Module" mean?
Which part of your app (e.g., /admin, /api/v2) has the issue.
Is the PoC safe to run in production?
Yes. Acunetix never deletes or modifies data.
How do I rescan a single issue?
Click the vulnerability, then "Rescan This Issue" button.
What are CWE numbers?
Standard codes for types of weaknesses. CWE-79 = XSS.
Can I add my company logo to the report?
Yes. Settings > Branding > Upload logo.
Why is the trend graph going down?
You fixed more issues than new ones appeared. Good job!
How do I send the report to Jira?
Export CSV, import into Jira, or use built-in integration.
What does "Business Impact" mean?
How the bug affects revenue, reputation, or compliance.
Can I schedule report emails?
Yes. Targets > Schedule > Send PDF to email list.
Where do I see scan duration?
Top of dashboard and page 1 of PDF.
How do I start reading a 50-page report?
Ignore pages. Go to dashboard, filter High+Critical, fix those first.
What's Your Reaction?