Why Should Every SOC Team Master Splunk Dashboards?
Picture a Security Operations Center (SOC) as the nerve center of an organization’s cybersecurity defense, with analysts racing against time to detect and stop threats. In this high-stakes environment, where ransomware, phishing, and insider attacks are surging in 2025, having the right tools is everything. Enter Splunk dashboards—dynamic, visual displays that turn mountains of raw data into clear, actionable insights. Splunk, a leading Security Information and Event Management (SIEM) platform, empowers SOC teams to monitor, analyze, and respond to threats in real-time. Mastering Splunk dashboards is like giving your team a superpower: the ability to spot anomalies, track incidents, and make decisions fast. In this blog, we’ll explore why every SOC team should master Splunk dashboards, offering practical tips in a beginner-friendly tone. I’ll explain technical terms simply and share how dashboards transform chaos into clarity. Let’s jump in and unlock Splunk’s potential!
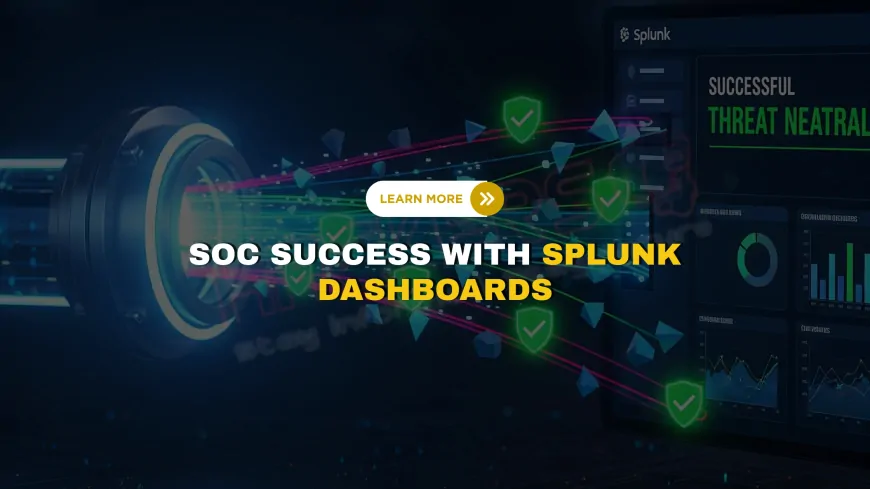
Table of Contents
- What is Splunk and Its Dashboards?
- Why Splunk Dashboards Are Essential for SOC Teams
- How Splunk Dashboards Work
- Creating Effective Splunk Dashboards
- Key Features of Splunk Dashboards
- Use Cases for SOC Dashboards
- Integrating Data Sources
- Automating Alerts with Dashboards
- Best Practices for SOC Dashboard Design
- Real-World Success Stories
- Splunk Dashboard Features Table
- Limitations and Alternatives
- Splunk Dashboards in 2025 and Beyond
- Conclusion
- FAQs
What is Splunk and Its Dashboards?
Splunk is a powerful platform that collects, analyzes, and visualizes data from systems, networks, and applications. Think of it as a super-smart librarian who can instantly find and summarize any book (data) in a massive library (your IT environment). In a SOC, Splunk gathers logs—records of system activity—to detect threats like malware or unauthorized logins.
Splunk dashboards are customizable, visual interfaces that display this data in charts, graphs, or tables. They’re like a car’s dashboard, showing key metrics (e.g., failed logins or network traffic spikes) at a glance. In 2025, SOC teams rely on dashboards to monitor threats in real-time, making Splunk a cornerstone of modern cybersecurity.
Why Splunk Dashboards Are Essential for SOC Teams
Cyber threats are relentless—2024 saw a 40% increase in data breaches. SOC teams need tools to keep up, and Splunk dashboards deliver:
- Real-Time Visibility: Spot threats instantly, like a spike in failed logins.
- Simplified Analysis: Turn complex logs into easy-to-read visuals.
- Faster Response: Prioritize critical alerts to stop attacks early.
- Compliance Support: Track incidents for standards like HIPAA or PCI DSS.
- Team Collaboration: Share dashboards for coordinated defense.
For beginners, dashboards are like a map that guides your team through the chaos of cyber threats, making Splunk a must-master skill.
How Splunk Dashboards Work
Splunk dashboards pull data from indexed logs, processed using Search Processing Language (SPL). SPL queries, like index=main sourcetype=syslog | stats count by host, filter data for display. Dashboards then visualize results as charts, tables, or gauges.
For example, a dashboard might show a line graph of network traffic, flagging spikes as potential DDoS attacks. Users interact with dashboards via Splunk’s web interface, drilling down into alerts for details. In 2025, dashboards support real-time updates and AI-driven insights, enhancing SOC efficiency.
Creating Effective Splunk Dashboards
Building a dashboard in Splunk is straightforward:
- Go to Splunk’s web interface and select “Dashboards.”
- Create a new dashboard, naming it (e.g., “SOC Threat Overview”).
- Add panels using SPL queries, like
index=security | timechart count by eventtype. - Choose visualizations (e.g., bar chart or pie chart).
- Customize layouts and share with your team.
Beginners can use Splunk’s Dashboard Studio for drag-and-drop creation, while pros can code XML for advanced layouts. Test with sample data to ensure clarity.
Key Features of Splunk Dashboards
Splunk dashboards offer:
- Custom Visuals: Charts, maps, and tables tailored to your needs.
- Real-Time Updates: Live data feeds for instant insights.
- Drilldowns: Click visuals to explore underlying data.
- Alerts: Trigger notifications for specific conditions, like malware detections.
- Sharing: Export or share dashboards across teams.
In 2025, AI features like anomaly detection enhance dashboards, spotting patterns humans might miss.
Use Cases for SOC Dashboards
Dashboards shine in scenarios like:
- Threat Detection: Monitor login failures to catch brute-force attacks.
- Incident Response: Track malware spread across servers.
- Compliance: Log access attempts for HIPAA audits.
- Network Monitoring: Visualize traffic spikes for DDoS alerts.
- Insider Threats: Flag unusual file access by employees.
Integrating Data Sources
Splunk dashboards pull data from:
- Logs: System, application, or firewall logs (e.g., Syslog).
- Security Tools: OSSEC, Snort, or CrowdStrike feeds.
- Cloud Platforms: AWS, Azure, or Google Cloud logs.
- Network Devices: Routers or switches via SNMP.
Use Splunk’s Universal Forwarder to collect data from remote systems. In 2025, cloud-native integrations make dashboards ideal for hybrid environments.
Automating Alerts with Dashboards
Dashboards can trigger alerts when thresholds are met, like:
- More than 10 failed logins in a minute.
- Unusual data transfers exceeding 1GB.
Configure alerts in Splunk via “Save As > Alert” after creating an SPL query. Set actions like emailing the SOC team or running a script to block IPs. Automation saves time, letting analysts focus on critical threats.
Best Practices for SOC Dashboard Design
- Keep it simple: Focus on key metrics (e.g., top 5 threats).
- Use clear visuals: Avoid cluttered charts; prefer bar or line graphs.
- Prioritize real-time data for urgent threats.
- Tailor dashboards to roles (e.g., analysts vs. managers).
- Test queries to ensure accuracy.
- Update dashboards as threats evolve.
Real-World Success Stories
A hospital used a Splunk dashboard to detect ransomware in real-time, isolating infected servers and saving patient data. A retail chain tracked phishing attempts via dashboards, reducing breaches by 40%. For compliance, a clinic used dashboards to log access attempts, passing a PCI DSS audit with ease.
Splunk Dashboard Features Table
| Feature | Purpose | SOC Benefit |
|---|---|---|
| Real-Time Visuals | Live data display | Instant threat detection |
| Drilldowns | Explore data details | Faster incident analysis |
| Alerts | Notify on conditions | Automated response |
| Custom Visuals | Tailored charts/tables | Role-specific insights |
| Cloud Integration | Cloud data feeds | Hybrid environment monitoring |
Limitations and Alternatives
Splunk’s cost (especially Enterprise) can be high, and its learning curve is steep for SPL. It may overwhelm small SOCs with data volume. Alternatives include Elastic Stack (open-source, cheaper) or QRadar (enterprise-focused). Splunk’s dashboard flexibility and integrations keep it a SOC favorite.
Splunk Dashboards in 2025 and Beyond
In 2025, Splunk dashboards leverage AI for predictive analytics, spotting threats before they strike. Cloud-native features support AWS and Azure, while integrations with SOAR platforms automate responses. As IoT and 5G grow, dashboards will monitor new attack surfaces, ensuring SOCs stay ahead.
Conclusion
Splunk dashboards are a game-changer for SOC teams, turning raw data into clear, actionable insights. They enable real-time threat detection, faster responses, and compliance support, making them a must-master skill in 2025. Start with simple dashboards, integrate key data sources, and follow best practices to maximize impact. Whether you’re a beginner or a seasoned analyst, Splunk dashboards empower your team to protect against evolving threats. Thanks for reading—now go build your first dashboard and take control of your SOC!
FAQs
What is Splunk?
A SIEM platform that collects and analyzes data for security monitoring.
What are Splunk dashboards?
Visual interfaces displaying data as charts or tables for SOCs.
Why are dashboards important for SOCs?
They provide real-time insights to detect and respond to threats.
Can beginners use Splunk dashboards?
Yes, with Dashboard Studio’s drag-and-drop interface.
What’s SPL?
Search Processing Language, Splunk’s query language for data analysis.
How do I create a dashboard?
Use Splunk’s web interface, add panels with SPL, and choose visuals.
Can dashboards show real-time data?
Yes, they update live for instant threat visibility.
What data sources work with Splunk?
Logs, security tools, cloud platforms, and network devices.
Can Splunk dashboards trigger alerts?
Yes, for conditions like failed logins or traffic spikes.
Is Splunk free?
It offers a free trial; Enterprise requires a license.
What’s a drilldown?
Clicking a visual to see detailed data behind it.
Can Splunk integrate with cloud platforms?
Yes, with AWS, Azure, and others via apps.
How do dashboards help compliance?
They log incidents for standards like HIPAA or PCI DSS.
What’s a good starter dashboard?
One showing failed logins or network traffic trends.
Does Splunk use AI?
Yes, for anomaly detection and predictive analytics in 2025.
Can dashboards be shared?
Yes, via Splunk’s interface or exported reports.
What’s an alternative to Splunk?
Elastic Stack for open-source or QRadar for enterprise.
How do I learn Splunk dashboards?
Use Splunk’s docs, YouTube, or platforms like Splunk Fundamentals.
Can Splunk monitor IoT devices?
Yes, with proper data feeds and integrations.
Is Splunk worth the cost?
For large SOCs, yes; smaller teams may prefer free alternatives.
What's Your Reaction?






















![Top 10 New Features in RHEL 10 [2025 Update]](https://www.hackers4u.com/uploads/images/202508/image_430x256_68b051d80982c.webp)
